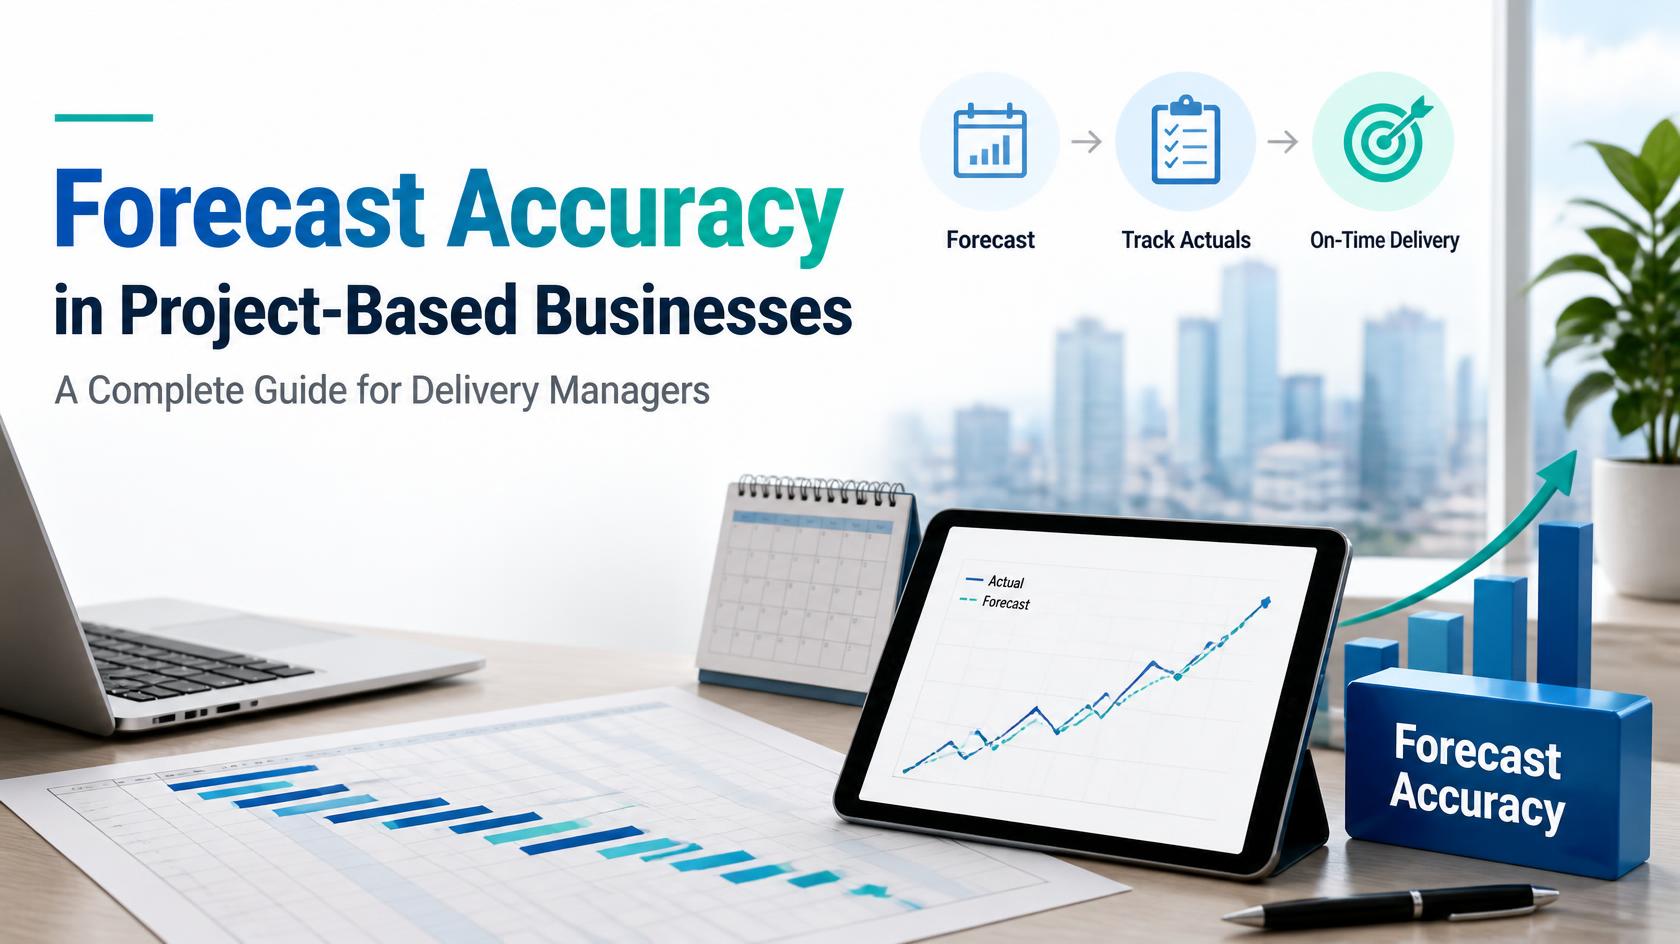
Forecast Accuracy in Project-Based Businesses: A Complete Guide for Delivery Managers
7 PM tools ranked for professional services. Features, comparison table, and verdict.
Date Posted:
October 14, 2026
Share This:
Forecast Accuracy in Project-Based Businesses: A Complete Guide for Delivery Managers
Every delivery manager has sat in a quarterly review where the revenue number did not match the forecast. Sometimes it was close. Sometimes it was not. Forecast accuracy is the metric that tells you how reliable your forward-looking revenue and delivery estimates actually are, and in project-based businesses, it is one of the clearest indicators of operational maturity. This guide explains what it is, how to calculate it, what causes it to break down, and how to fix it.
What is Forecast Accuracy?
Forecast accuracy in a project-based business measures how close your predicted revenue, utilization, or project outcomes were to what actually happened. It is the ratio of your forecast to your actuals, expressed as a percentage. A perfect forecast scores 100%. Every point below that represents a gap between what your delivery operation expected and what it delivered.
In professional services, forecast accuracy matters at three levels. At the project level, it tells you whether individual engagement estimates were reliable. At the practice or portfolio level, it reveals whether your pipeline-to-delivery translation is consistent. At the firm level, it drives investor confidence, hiring decisions, and the quality of every strategic plan your leadership team builds.
Forecast accuracy is the percentage by which your actual results matched your predicted results over a given period. It applies to revenue forecasts, utilization forecasts, project cost estimates, and delivery timelines. Low accuracy is not just a finance problem: it is a delivery operations problem.
How to Calculate Forecast Accuracy
There are two common formulas. Both are valid; pick the one that fits your reporting context.
Version 1: Simple Accuracy Percentage
Version 2: Mean Absolute Percentage Error (MAPE)
Use the simple accuracy percentage for single-period reporting and board presentations. Use MAPE when you are tracking forecast quality over rolling quarters and want a consistent measure across periods of different sizes.
Industry Benchmarks: What is a Good Forecast Accuracy Score?
SPI Research benchmarks show that top-quartile professional services firms achieve forecast accuracy above 90% consistently. Firms below 80% typically share a common set of root causes: disconnected pipeline and delivery data, no systematic stage-gate review, and forecasts built from instinct rather than operational signals.
Why Forecast Accuracy Breaks Down: 6 Root Causes
Sales closes a deal at one scope and margin assumption. Delivery executes against a different reality. When CRM and PSA do not share data, the forecast is built on stale deal information from the moment the contract is signed.
Hours entered in bulk at month end, reconstructed from memory, cannot generate a reliable utilization forecast. If the input data is wrong, every forecast built from it is wrong by the same margin.
Change orders that are delivered but not formally documented update the work but not the forecast model. Revenue and cost estimates drift from reality with every untracked change.
A project estimate built at kickoff that is never revised as the engagement progresses will be wrong by close. Forecast accuracy requires rolling updates as real delivery data accumulates.
Sales teams consistently over-weight pipeline probability. A deal at 70% confidence is often treated as near-certain. Systematic optimism inflates revenue forecasts across the portfolio.
Manual review cycles catch forecast variance after the period closes, not while the project is still in flight. Without proactive signals, delivery managers react to misses rather than preventing them.
Types of Forecast That Delivery Managers Track
| Forecast Type | What It Predicts | Primary Input | Review Cadence |
|---|---|---|---|
| Revenue Forecast | Expected billings and collections for the period | Pipeline stage, contract value, delivery progress | Weekly, monthly close |
| Utilization Forecast | Expected billable hours as a percentage of available capacity | Project allocations, resource availability, demand pipeline | Weekly, 4-week rolling |
| Project Cost Forecast | Expected cost to complete vs. original budget (EAC) | Actual hours, burn rate, remaining scope | Per milestone, weekly |
| Resource Demand Forecast | Expected headcount and skills needed for upcoming pipeline | Pipeline confidence scores, project start dates, role requirements | Monthly, 90-day horizon |
| Three-Year Revenue Forecast | Long-range revenue projection for planning and investment | Historical win rates, pipeline size, growth assumptions | Quarterly, annual planning |
How to Improve Forecast Accuracy in 2026
-
Connect pipeline data to delivery data in one system
The single most effective intervention. When the deal value, scope, and margin assumptions from the CRM flow directly into the PSA delivery model, forecasts are built from the same data that runs the project. Every change order updates both systems simultaneously.
-
Enforce daily timesheet capture, not weekly batch entry
Real-time timesheet data is the most reliable input to utilization and revenue forecasts. Implement daily time entry as policy and use automated reminders. Locking timesheets weekly removes the ability to reconstruct hours from memory.
-
Build rolling forecast reviews into your weekly operating rhythm
A forecast reviewed once at period open and once at close will miss everything that happened in between. Weekly forecast reviews that compare actual burn against predicted burn let delivery managers intervene while the project is still open.
-
Apply stage-gate probability discipline to your pipeline
Define historical win rates by sales stage and use them to weight forecast revenue rather than relying on individual sales rep estimates. If your Q3 pipeline at the Solution Proposal stage has historically converted at 45%, forecast at 45%, not at whatever the rep believes.
-
Track Estimate at Completion (EAC) on every active project
EAC is the current best estimate of total project cost based on actual spend to date plus remaining work. Monitoring EAC weekly gives delivery managers an early signal of budget overruns before they hit the invoice and the P&L.
-
Use AI to surface forecast drift before the period closes
Manual variance analysis finds problems after the fact. AI-native platforms detect forecast drift in real time: when actual utilization deviates from the plan by more than a configurable threshold, the system flags it rather than waiting for a manager to run a report.
KEBS connects pipeline data from the CRM, resource allocation from RMG, and actual delivery hours from timesheets in one data model. Revenue forecasts are not built from static spreadsheet assumptions: they recalculate continuously as real project data comes in. When a project runs 10% over budget in week three, the revenue and margin forecast updates immediately.
KII (KEBS Inform) monitors forecast drift across every active project and surfaces variance alerts before the delivery manager has to look for them. KIR (Recommend) factors historical win rates into pipeline forecasting so that revenue predictions are weighted by what has actually converted, not what sales teams estimate. KIA (Act) automates three-year revenue forecasting across FY, FY2, and FY3 horizons based on live pipeline and delivery data.
Customers including Maveric Systems, Zifo Technologies, Mindsprint, and Agilisium use KEBS to maintain forecast accuracy above 90% across their delivery portfolios. The difference is not analytical discipline alone: it is having a platform where the forecast and the delivery operation share the same live data.
Frequently Asked Questions
Stop Forecasting Blind. Build Your Revenue View on Live Delivery Data.
KEBS connects pipeline, resource allocation, and project actuals in one platform so your forecast is always built from what is actually happening, not last month's spreadsheet. KII detects drift. KIA automates three-year forecasting. Rated 4.7/5 on G2.
Book a Free Demo →