How to Measure the ROI of an AI Agent in Professional Services
7 PM tools ranked for professional services. Features, comparison table, and verdict.
Date Posted:
September 24, 2026
Share This:
How to Measure the ROI of an AI Agent in Professional Services
Every vendor selling AI to professional services firms claims transformative ROI. Few of them give you the framework to measure whether it actually arrived. AI agent ROI in professional services is genuinely measurable: it shows up in utilization rates, billing realization, collection cycles, and manager hours recovered. But measuring it requires a clear baseline, the right metrics, and the discipline to separate AI impact from other operational changes happening simultaneously. This guide gives you the complete framework.
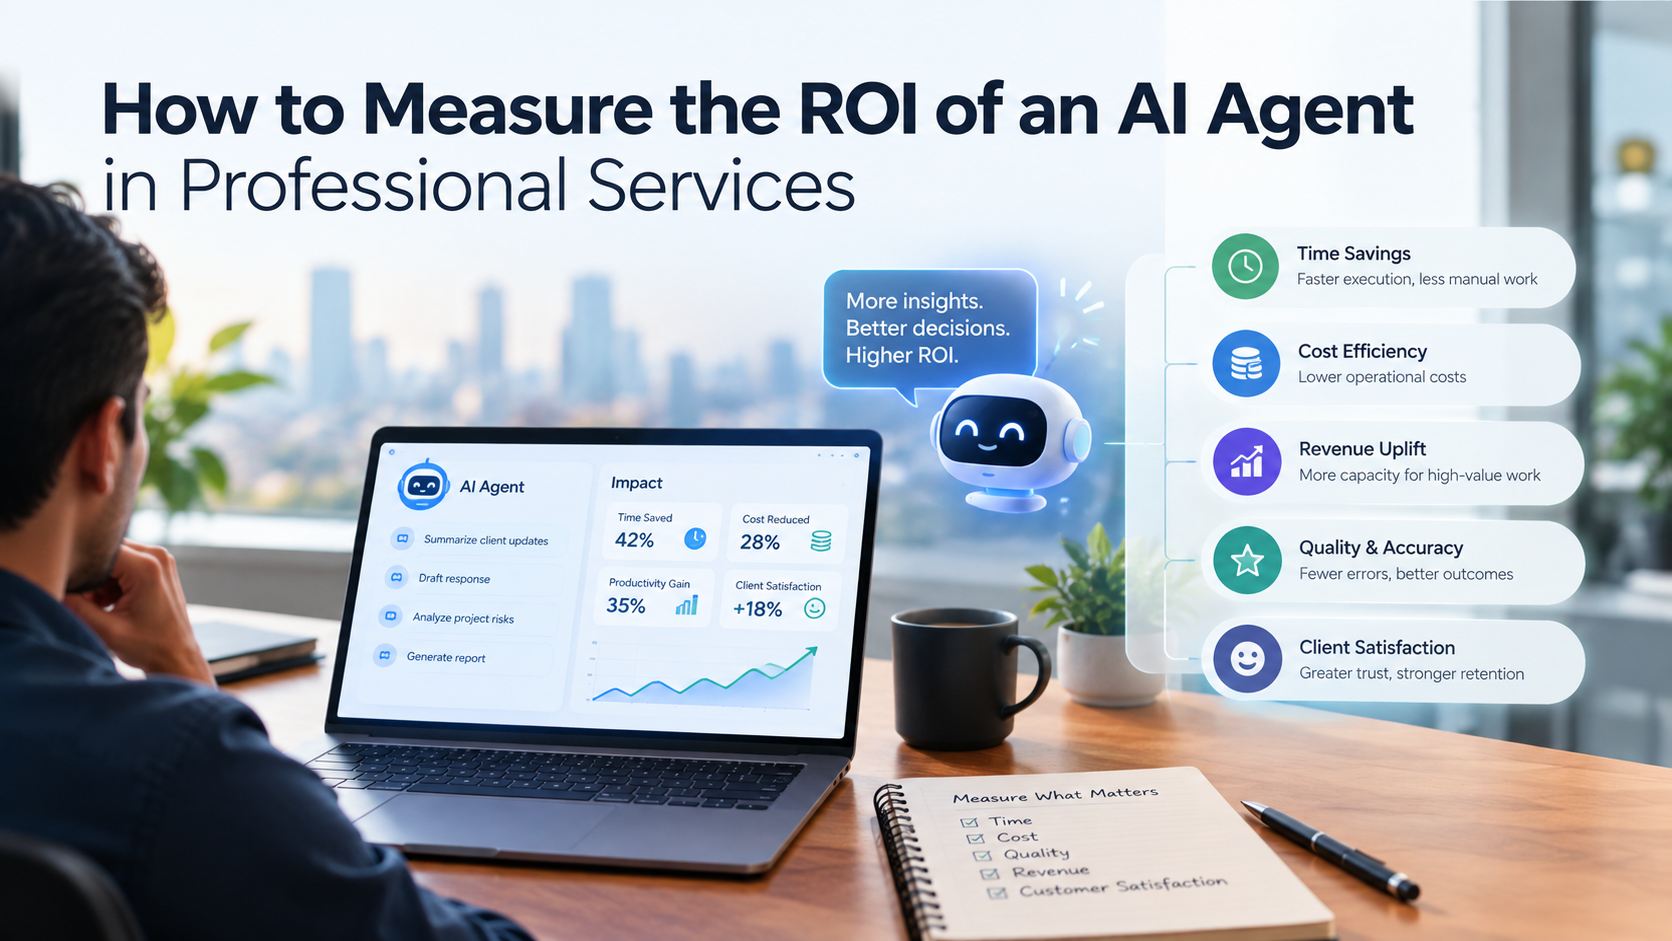
AI agent ROI in professional services shows up in four places: recovered revenue from better utilization and billing, reduced cost from automation replacing manual operational work, faster cash flow from shorter billing and collection cycles, and better margin from earlier detection of delivery risk. All four are measurable with a baseline, a timeframe, and the right data connections.
Why Measuring AI ROI in Professional Services Is Harder Than It Looks
The challenge with AI ROI measurement in professional services is not that the benefits are intangible. They are not. The challenge is attribution: separating the impact of the AI agent from the impact of other simultaneous changes, such as a new delivery process, a new resource management approach, or simply a better quarter in the business.
The firms that measure AI ROI accurately do three things: they establish a clear pre-deployment baseline across the specific metrics they expect to move, they measure with a consistent methodology for at least two full quarters post-deployment, and they control for other major operational changes during the measurement window. Firms that skip the baseline tend to report AI ROI numbers that cannot be verified, which creates board-level skepticism about AI investment even when real value has been delivered.
The Measurement Framework: Before, During, After
Measure your current state across all four ROI categories: utilization rate by practice and business unit, billing realization rate by client and project type, DSO for the trailing 90 days, manager hours spent on operational monitoring and reporting per week, and average time from delivery milestone to invoice raised. These numbers are your denominator. Without them, you cannot calculate ROI: you can only describe what changed.
Before going live, agree with your leadership team on which three to five metrics will be used to evaluate AI ROI, what success looks like numerically for each, and over what period you will measure. A 90-day window is too short for utilization trends. A 12-month window is appropriate for revenue and margin impact. A 60-day window is usually enough to see DSO and billing cycle changes.
Track metrics at the same cadence post-deployment as you measured them at baseline. When you see improvements, document what the AI agent specifically did to drive them: which alerts fired, which recommendations were acted on, which actions were automated. Linking specific agent actions to specific business outcomes is what converts a directional story into a measurable ROI case.
If utilization improved 4 percentage points in Q3 and you also hired three new delivery managers in Q3, the AI agent may have contributed but the hiring also contributed. Document any significant operational changes during your measurement window so your ROI calculation can account for them or caveat them appropriately.
Hard ROI Metrics: What to Measure and How
| Metric | Baseline Measure | AI Impact Mechanism | How to Calculate ROI |
|---|---|---|---|
| Billable Utilization Rate | Current billable hours / available hours by practice | Agent detects bench gaps earlier and matches demand to available resources faster, reducing unplanned bench time | (New utilization % - Baseline %) x Billable headcount x Avg billing rate x Working hours |
| Billing Realization Rate | Actual invoiced / billable value at standard rates | Agent surfaces scope creep earlier, triggers change order prompts, reduces write-downs from late-detected overruns | (New realization % - Baseline %) x Total billable revenue |
| Days Sales Outstanding (DSO) | Trailing 90-day average AR collection period | Automated invoice triggers shorten the billing cycle; automated collection reminders reduce payment delays | DSO reduction x Daily revenue rate = Working capital improvement |
| Manager Hours on Operations | Hours per week per manager on reporting, matching, manual follow-up | Agent replaces dashboard monitoring, manual resource matching, and collections follow-up with automated workflows | Hours recovered x Manager fully-loaded cost x Number of managers |
| Project Margin Variance | Average variance between estimated and actual project margin at close | Earlier risk detection allows intervention during delivery rather than post-mortem after close | Reduction in margin variance x Project revenue volume |
Soft ROI Metrics: Real but Harder to Quantify
Delivery managers who spend 6+ hours per week on manual operational reporting consistently score lower on engagement surveys. Recovering that time to client-facing and strategic work improves retention. Attrition cost for a senior delivery manager is typically 1.5x to 2x annual salary.
When AI agents detect delivery risk early and allow proactive client communication rather than reactive excuse-making, client satisfaction scores improve. NPS improvements are real revenue events: higher NPS clients renew more and expand more.
When revenue forecasts are built from live agent-monitored data rather than manually assembled spreadsheets, forecast accuracy improves. Better forecast accuracy changes how leadership invests: more confident hiring, more aggressive pipeline pursuit, faster strategic decisions.
A firm that grows from 100 to 200 billable staff without proportional growth in operations headcount is capturing AI ROI even if it does not show up as a direct cost reduction. The agent absorbs operational monitoring workload that would otherwise require additional management hires.
The AI Agent ROI Calculation
A practical ROI calculation for a 100-person IT services firm deploying an agentic PSA for 12 months:
| ROI Category | Assumption | Estimated Annual Value |
|---|---|---|
| Utilization improvement | 3 pp increase (from 67% to 70%), 100 staff at $85/hr avg billing rate, 1,760 hrs/year | $447,360 |
| Realization improvement | 2 pp increase (from 83% to 85%), $12M annual revenue | $240,000 |
| DSO reduction | 14-day reduction, $12M revenue, 8% cost of capital | $36,822 |
| Manager time recovered | 5 hrs/week x 10 managers x $120/hr fully loaded x 48 working weeks | $288,000 |
| Margin variance reduction | 2 pp improvement in project margin across $12M revenue | $240,000 |
| Total estimated annual value | $1,252,182 | |
| KEBS platform cost (100 users, mid-tier mix) | $25/user/month average across role mix | $30,000 |
| Net ROI Year 1 | ~40x return on platform investment |
These are conservative assumptions based on industry benchmark data. Real ROI varies by firm size, current operational maturity, and how completely the platform is adopted. The key insight is that the denominator (platform cost) is small relative to the numerator (operational improvement) even at conservative improvement assumptions. The bottleneck to AI ROI is almost never the cost of the platform. It is the quality of the data foundation and the completeness of adoption.
When to Expect ROI: The Realistic Timeline
Common Measurement Mistakes to Avoid
The most common mistake. Without a baseline, you cannot calculate ROI: you can only describe direction. Establish baseline metrics 4 to 8 weeks before go-live, using the same methodology you will use post-deployment.
AI agents improve as they accumulate operational history. A 30-day post-deployment review is almost never representative of steady-state performance. Commit to a 90-day minimum before drawing conclusions about ROI trajectory.
If you also changed your resource management process, hired new managers, and improved timesheet discipline simultaneously, the AI is one of several contributing factors. Document all concurrent changes to maintain credibility in your ROI narrative.
An AI agent that fires recommendations that managers consistently ignore will show poor ROI not because the AI is wrong but because the workflow has not been adopted. Track recommendation acceptance rates alongside outcome metrics to diagnose adoption vs. algorithm issues.
KEBS tracks the specific actions taken by each KAIS layer and links them to business outcomes in a dedicated AI Impact dashboard. When KIA triggers an invoice automatically, the system records the time saving vs. manual process baseline. When KIR recommends a resource and the recommendation is accepted, the system tracks whether the resulting project delivered at or above target margin. When KII surfaces a bench alert and the manager acts, the system records whether the resource was placed before becoming a write-off.
This attribution layer means KEBS customers can answer the question "what ROI has our AI delivered this quarter" from a system report rather than from a manual analysis exercise. The platform maintains a running calculation of utilization improvement, billing cycle compression, and manager hours recovered based on pre-deployment baseline data stored at onboarding. For customers including Maveric Systems and Zifo Technologies, this has been the critical enabler of internal AI investment justification at board level.
Frequently Asked Questions
Know Exactly What Your AI Investment Is Returning. KEBS Makes It Measurable.
KEBS tracks every AI action and links it to business outcomes so you can report AI ROI by quarter, not by feeling. Utilization, realization, DSO, and manager hours: all measured against your pre-deployment baseline. Rated 4.7/5 on G2.
Book a Free Demo →