Home » PSApedia
Project revenue variance
Analyze Project Revenue Variance for Informed Decision-Making. Stay on Budget and Boost Profitability.
What is Project Revenue Variance?
Project Revenue Variance (PRV) is a financial metric that measures the difference between the projected revenue of a project and the actual revenue it generates. It provides insights into the accuracy of revenue forecasts and helps businesses identify areas of improvement in their revenue estimation processes.
In the context of Professional Service Automation (PSA), PRV is crucial for service-based businesses to ensure profitability and effective resource allocation.
Importance of Project Revenue Variance
Understanding PRV is essential for several reasons:
1. Accuracy in Forecasting: It helps in evaluating the accuracy of revenue projections, ensuring that businesses are not overestimating or underestimating their potential earnings.
2. Resource Allocation: By understanding the variance, companies can better allocate resources. For instance, if a project consistently underperforms in revenue, it might be worth reallocating resources to more profitable ventures.
3. Financial Stability: Regularly monitoring PRV ensures that businesses maintain financial stability. Significant variances can indicate potential cash flow issues, which can be addressed proactively.
4. Client Relationships: PRV can also indicate the health of client relationships. Consistently meeting revenue projections suggests that client projects are being executed effectively, leading to enhanced client relationships.
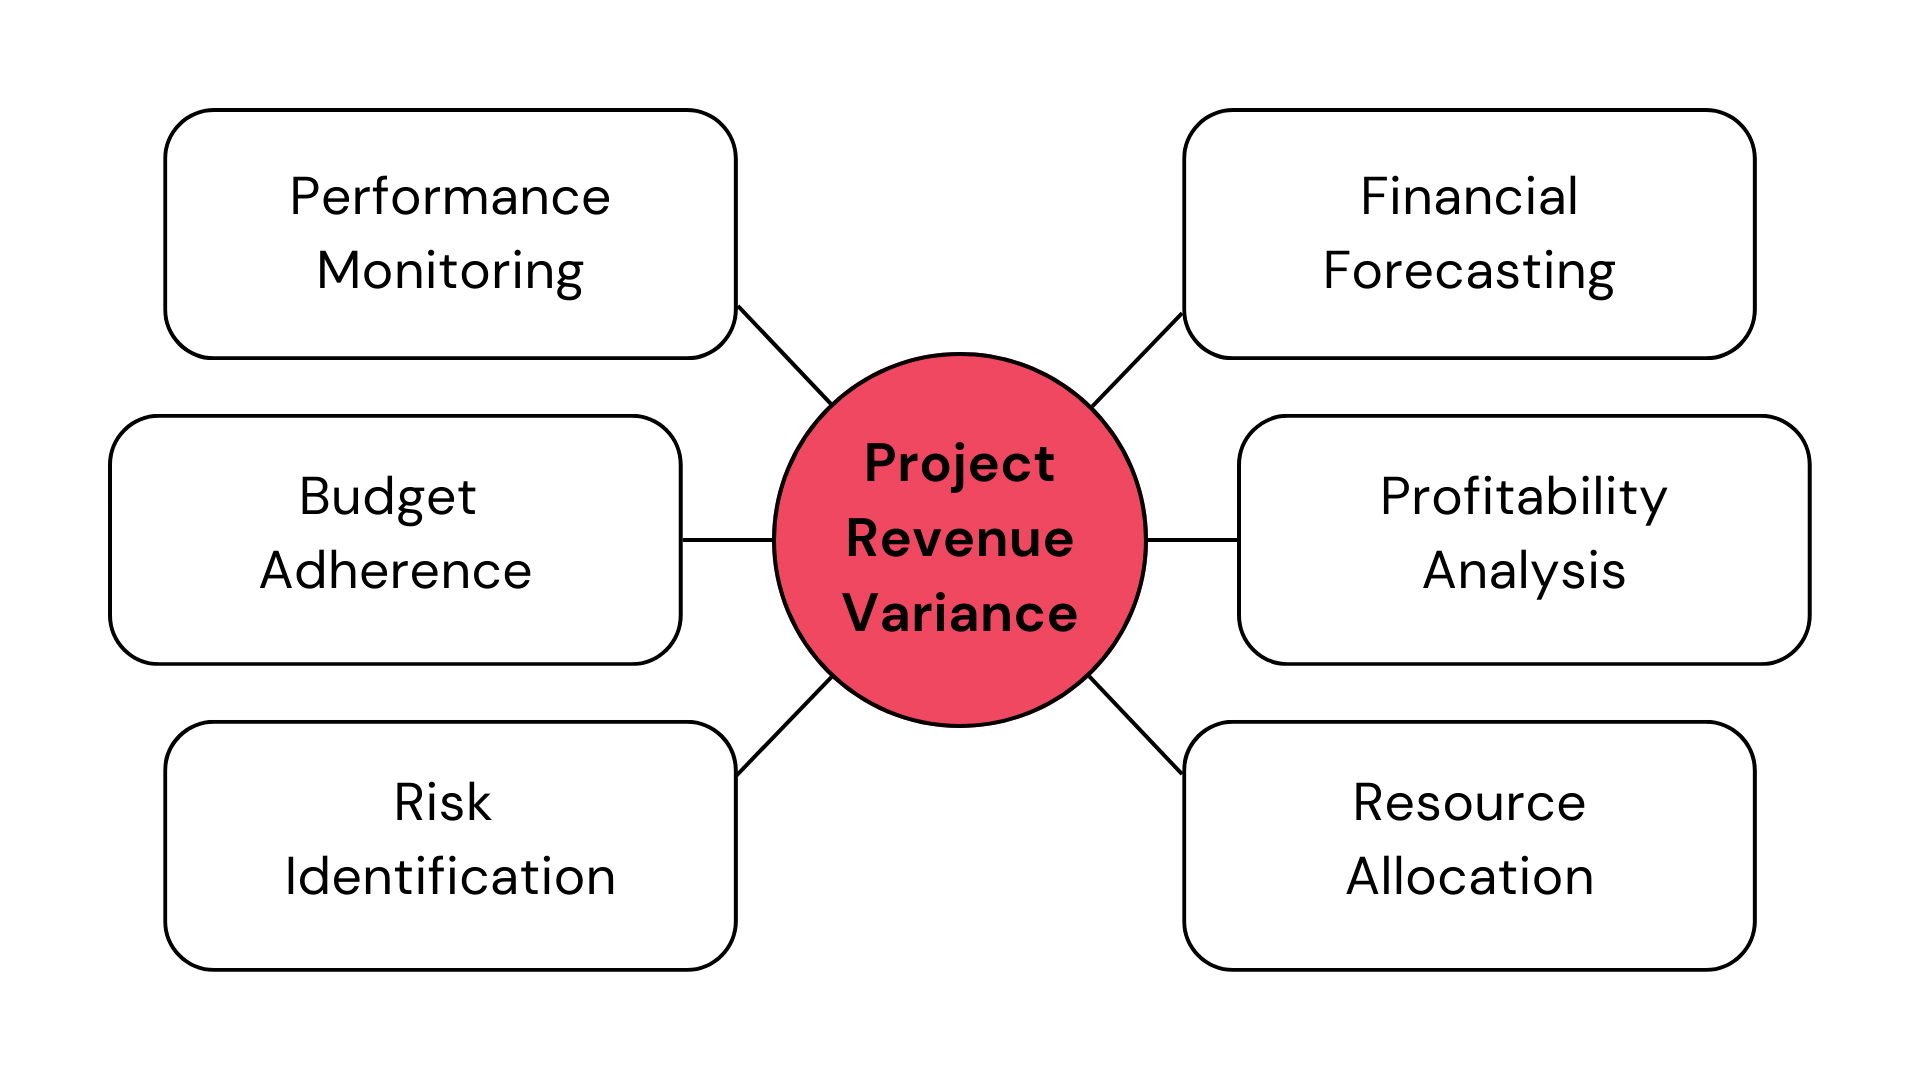
Why Project revenue variance is so important?
Calculating Project Revenue Variance
Formula:
Project Revenue Variance (PRV) = Actual Revenue − Projected Revenue
Example:
Let’s say a business projected a revenue of $100,000 for a project. However, at the project’s completion, the actual revenue was $90,000. The PRV would be:
PRV = $90,000 – $100,000
PRV = -$10,000
This negative variance indicates that the project earned $10,000 less than anticipated.
Project Revenue Variance vs Other Financial Metrics
While PRV focuses on the difference between projected and actual revenue, other financial metrics provide different insights:
1. Annual Recurring Revenue (ARR): This measures the value of the recurring revenue components of your term subscriptions, excluding one-time charges. It’s crucial for businesses with subscription models.
2. Monthly Recurring Revenue (MRR): Similar to ARR but on a monthly scale. It’s essential for businesses to understand their short-term revenue streams.
3. Earnings Before Interest and Taxes (EBIT): This provides insights into a company’s profitability without considering tax and interest expenses.
Comparing PRV with these metrics can offer a holistic view of a company’s financial health. For instance, a consistent negative PRV combined with declining ARR might indicate deeper issues in a company’s revenue model or project management practices.
| Financial Metric | Description | Significance in PSA |
|---|---|---|
| Project Revenue Variance | Measures the difference between expected and actual project revenue. A positive variance indicates revenue exceeding expectations, while a negative variance suggests revenue falling short of projections. | Essential for assessing project profitability and financial performance. It helps in identifying areas where revenue expectations are not being met, enabling corrective actions. |
| Gross Profit Margin | Calculates the percentage of revenue that represents gross profit (revenue minus the cost of goods sold). | Crucial for evaluating the efficiency of service delivery and pricing strategies, as it indicates how well a company is covering its direct costs. |
| Utilization Rate | Measures the percentage of billable hours worked by employees compared to the total available hours. | Key for optimizing resource allocation and ensuring that billable staff are efficiently utilized, which directly impacts revenue. |
| Billable Utilization Rate | Specifically measures the percentage of billable hours worked compared to total available hours for billable employees. | Offers insights into the efficiency of billable staff, helping in monitoring their contribution to revenue generation. |
How Project Revenue Variance is Used?
PRV is used in various ways:
1. Budgeting and Planning: Businesses can adjust their budgets based on PRV insights, ensuring they’re allocating funds effectively.
2. Strategy Formulation: If a particular service line consistently shows a negative PRV, businesses might reconsider its viability or look into ways to improve its profitability.
3. Performance Evaluation: PRV can be used to evaluate the performance of project managers and sales teams. Consistently accurate revenue projections might indicate effective project execution and client relationship management.
4. Resource Management: PRV insights can guide resource allocation, ensuring that resources are directed towards projects with the most promising revenue potential.
Ready to Enhance Project Revenue Variance?
KEBS, a leading PSA software, offers tools that can help businesses optimize their PRV. KEBS analytics can refine revenue projections, making them more accurate. With insights from KEBS, businesses can ensure that resources are directed towards the most profitable projects.
KEBS project management tools allow businesses to monitor projects in real-time, ensuring they stay on track to meet revenue projections. From ticket management to deal management, KEBS ensures that all financial processes are optimized for maximum profitability.
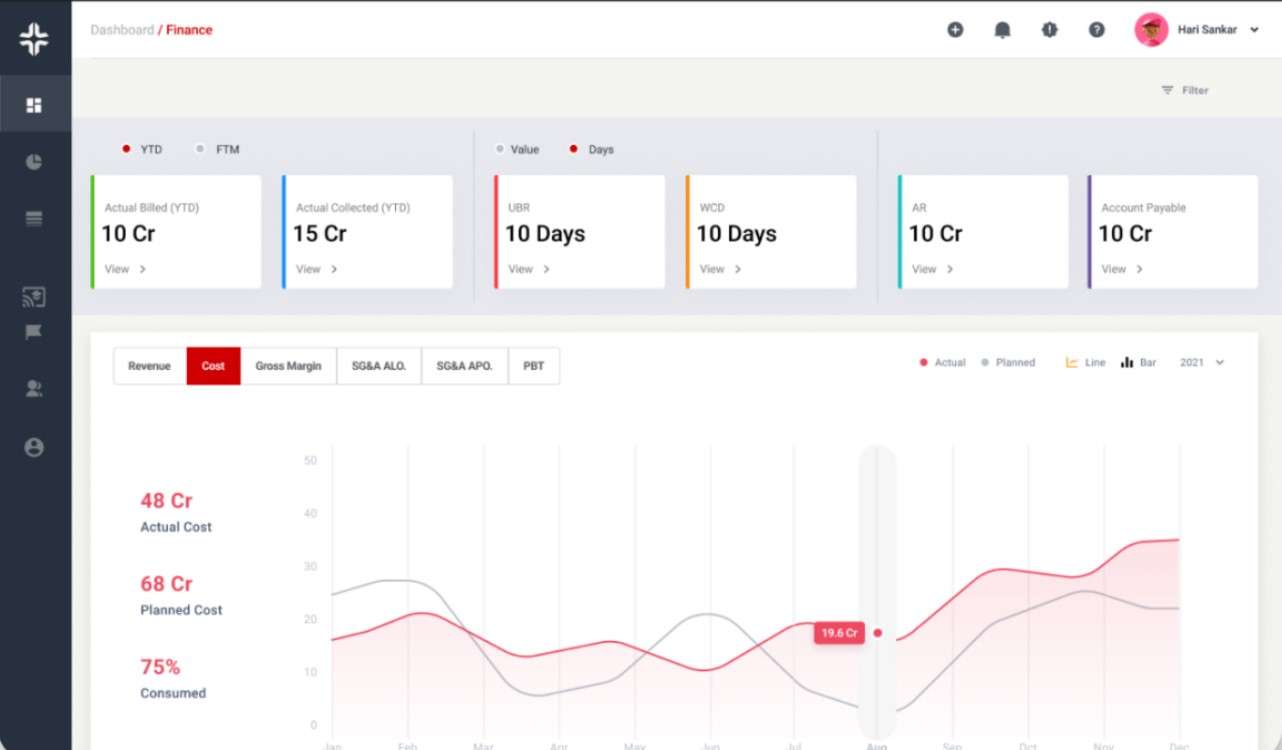
KEBS Finance Management
Ready to optimize your Project Revenue Variance? Contact KEBS today or request a demo to see how KEBS can transform your financial management practices.