Home » PSApedia
Opportunity to Win Ratio
Enhance Business Strategies with Opportunity to Win Ratio Analysis.
What is Opportunity to Win Ratio?
Opportunity to Win Ratio (OWR) is a key performance metric used in sales and marketing to measure the effectiveness of a sales team or process.
It represents the number of won sales opportunities compared to the total number of opportunities presented. In essence, it gives businesses a clear picture of their sales conversion efficiency.
Importance of Opportunity to Win Ratio
Understanding your OWR is crucial for several reasons:
1. Performance Analysis: It helps businesses identify the effectiveness of their sales strategies.
2. Resource Allocation: By understanding which strategies yield the highest OWR, companies can allocate resources more efficiently.
3. Predictability: A consistent OWR can help businesses forecast future sales and revenue.
4. Improvement Opportunities: A low OWR can highlight areas for training or process improvement.
Why Opportunity to Win Ratio is so important?
How to Calculate Opportunity to Win Ratio?
Formula:
Opportunity to Win Ratio (OWR) = (Number of Won Opportunities/Total Number of Opportunities) × 100
Example:
Let’s say in a month, a sales team had 100 opportunities and successfully closed 30 deals.
OWR=(30/100)×100=30%
This means the sales team has a 30% Opportunity to Win Ratio.
Difference Between Opportunity to Win Ratio and Other Metrics
OWR is often confused with other sales metrics. For instance:
- Lead Conversion Ratio: Measures the number of leads that convert into opportunities.
- Close Rate: Measures the percentage of opportunities that turn into actual sales.
While these metrics provide insights into the sales process, OWR specifically focuses on the efficiency of converting opportunities into wins.
| Metric | Description | Use Case | Key Differences |
|---|---|---|---|
| Opportunity to Win Ratio | Measures the likelihood of closing a sales opportunity. It’s typically calculated as (Number of Won Opportunities) / (Total Number of Opportunities). | Sales Forecasting | Focuses on sales and revenue prospects. |
| Utilization Rate | Measures the percentage of billable hours worked by employees in relation to their total available working hours. It’s calculated as (Billable Hours) / (Total Available Hours). | Resource Management | Focuses on employee productivity. |
| Project Profitability | Measures the profitability of a specific project by comparing revenue earned to the costs incurred. It’s calculated as (Project Revenue – Project Costs) / Project Costs. | Project Management | Specific to individual project analysis. |
How Opportunity to Win Ratio is Used?
OWR is used in various ways:
1. Sales Training: Teams with low OWR might benefit from additional training or resources.
2. Strategy Refinement: Businesses can adjust their sales strategies based on OWR outcomes.
3. Budgeting and Forecasting: A consistent OWR can aid in predicting future revenue, helping in budget allocation.
4. Competitive Analysis: Comparing your OWR with industry benchmarks can provide insights into market position.
For businesses using Professional Service Automation (PSA), OWR can be integrated into the system for real-time tracking and analysis.
Ready to Optimize Your Opportunity to Win Ratio?
KEBS, a leading PSA Software, offers tools that can significantly enhance your OWR. With KEBS deal management software, track opportunities and refine strategies for better conversion. KEBS project management software offers insights into sales performance, helping businesses adjust in real-time.
KEBS finance management software ensures that sales data is seamlessly integrated, providing a holistic view of business performance.
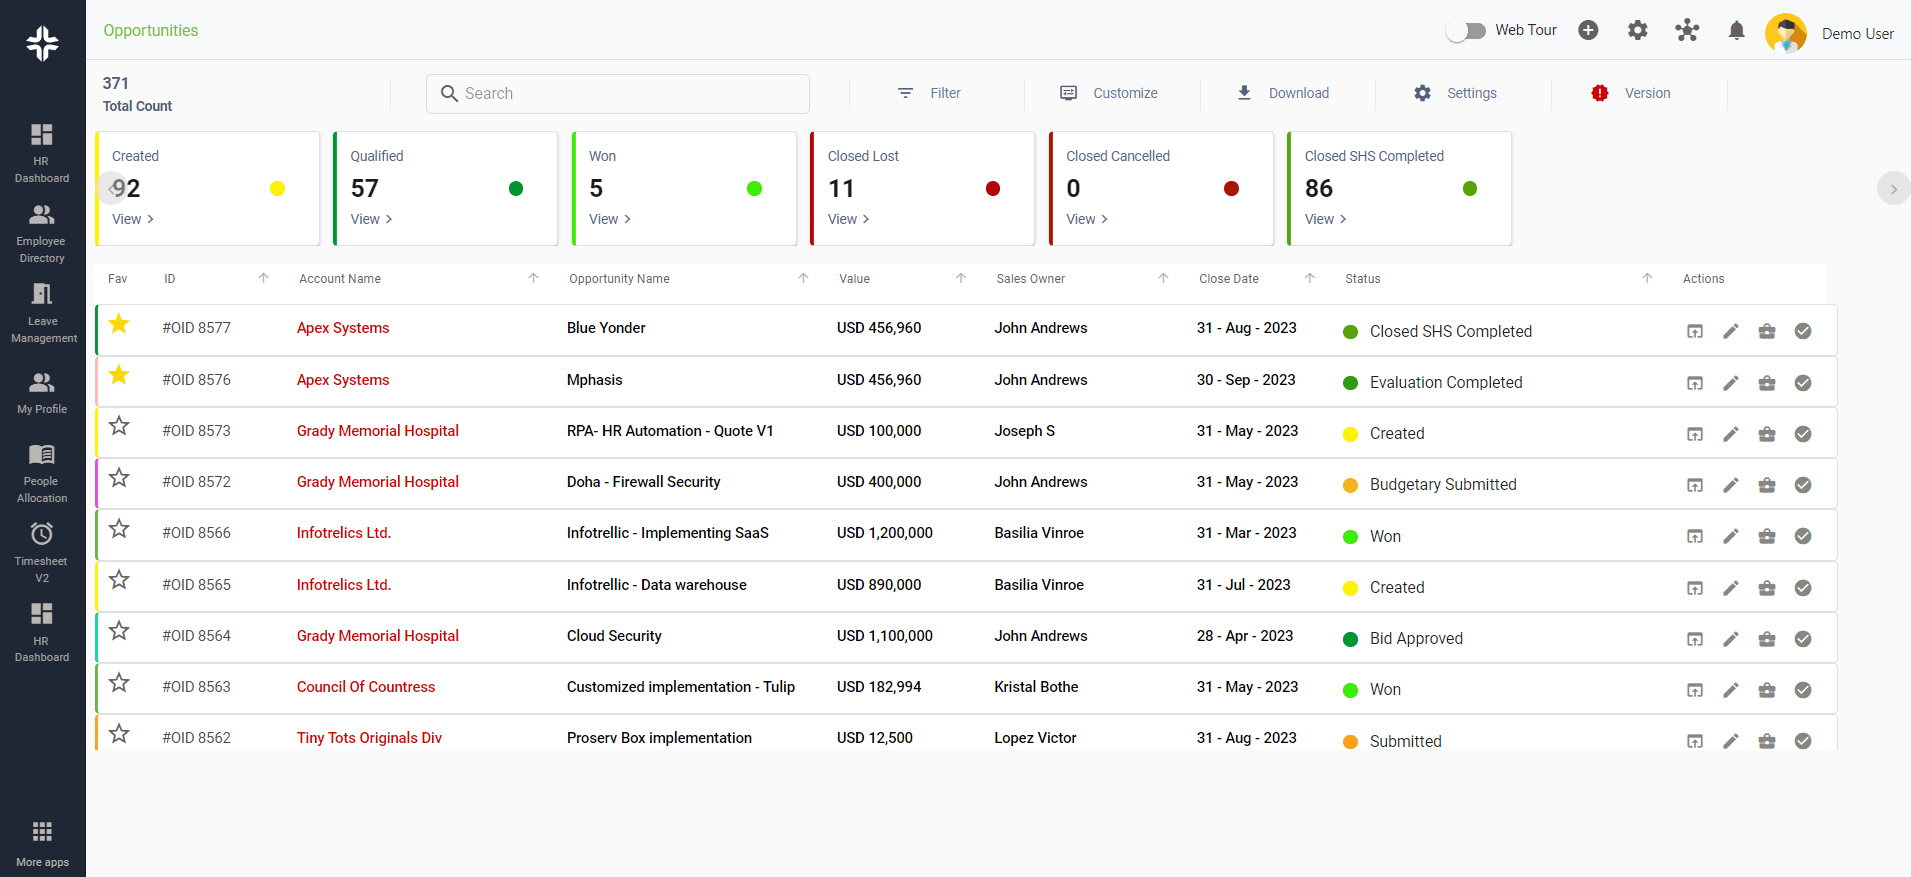
KEBS Oppurtunities
Ready to optimize your Opportunity to Win Ratio? Contact KEBS today or request a demo to see how KEBS can transform your sales process.